What are Candlestick Charts in Trading?

Candlesticks are powerful technical tools because they can display data from across several time frames in a single price bar. The patterns created by these bars over time can help traders identify key support and resistance levels and make informed predictions about the potential direction of future price movements.
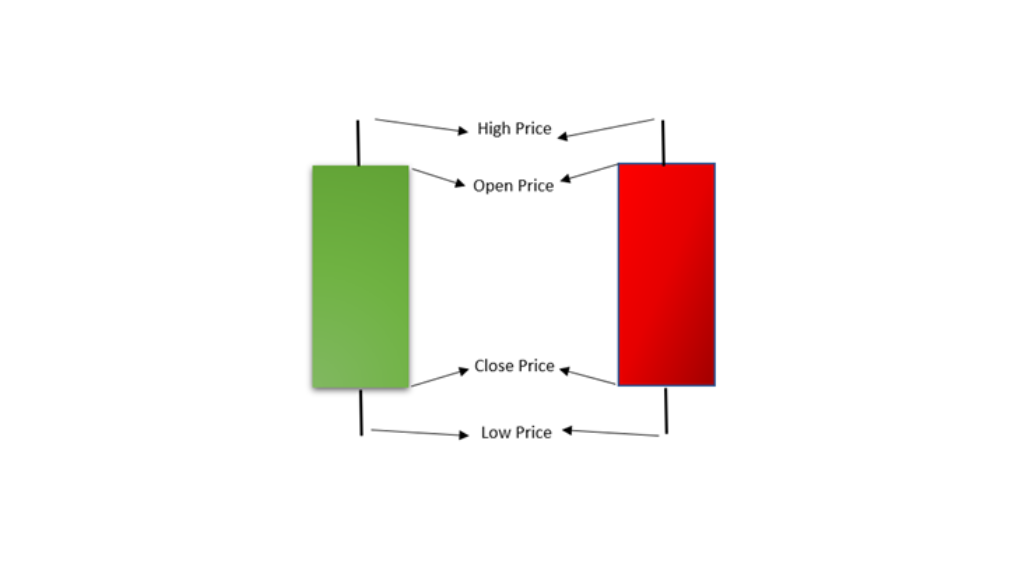
A candlestick is made up of a body, which represents the price range of the instrument that is laid out according to the timeframe chosen on the platform. It is not only the wick and movement of the candlestick, but also the color indicator.
– An empty (white or green) body indicates price rise
– A full (black or red) body indicates a price decline

