Moving Averages
Moving Average (MA) measures the average of a certain body data. Its purpose is to identify a new trend or that an old trend has ended or reversed. However, MA line lags the market action because it averages the previous price data. It is produced by a smoother line that makes it easier to view and underline the trend.
The Simple Moving Average
This is the most used type of MA. The MA is calculated by adding up the least ‘x’ periods in the closing prices and then dividing it by the ‘x’ number. So in a 5 period average, each period would have an equal 20% weighting. However, some analysts believe that it should weight heavier to the most recent price actions.

The Expodential Moving Average
This type of average gives more weight to the recent price actions. In addition, the user is allowed to adjust the weighting according so he can give more or less weight to the most resent price actions.
Xglobal Group
we introduce you to our group of forex companies:
XGLOBAL AFRICA
XGLOBAL Africa (Pty) Ltd is south African Financial Firm regulated by the FSCA with FSP 51306
XGLOBAL Markets
XGLOBAL Markets Ltd is a European investment firm that is authorized and regulated by the Cyprus Securities
XGLOBAL FX
XGLOBAL FX Ltd is an international broker regulated by VFSC (Vanuatu Financial Services Commission)
Using One Moving Average
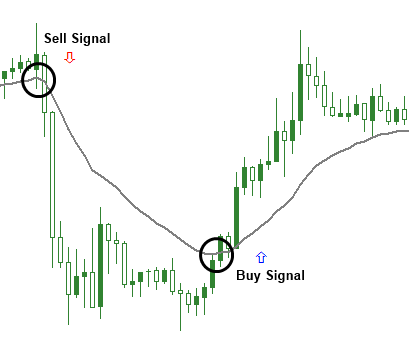
Some traders use one MA so they can generate a trend signal. When the closing price of a candlestick moves above the MA then a buy signal is generated. In contrary, when the prices move below the MA, a sell signal is generated.
However, if you employ a short term average then you will experience several crossings which may produce more trades and might result to many false signals. This is due to the sensitivity that exists In the MA because some of the random price movements will generate some bad trend signals.
The advantage is that the MA gives a trend signal earlier in the move because when the MA is more sensitive the earlier the signal will be.

Using Two Averages
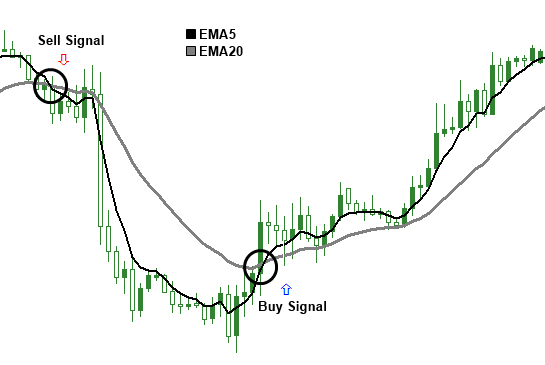
This is also called the double crossover method. When a shorter average crosses above a longer average then it produces a buy signal. A popular combination is the 5 and 20 averages. A buy signal occurs when the 5 period average crosses above the 20 period average. On the other hand, a sell signal is produced when the 5 period average crosses below the 20 period average.

Read More

