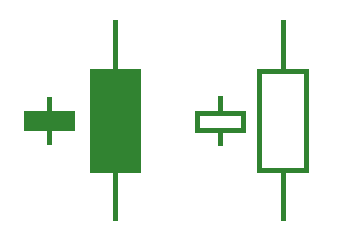
Double Candlestick Patterns
Bullish Engulfing
A reversal pattern that produces a bullish signal when a bearish candlestick is followed by a larger bullish candlestick. It should be ignored if the combination of the two candlesticks does not occur after a downtrend. The shorter the body of the bearish candlestick, the longer the body of the bullish candlestick, and the stronger the signal. This pattern is usually an important reversal signal.

Bearish Engulfing
It is the exact opposite of the bullish engulfing pattern. After a defined uptrend, an engulfing bearish pattern is formed when a bullish candlestick is followed by a larger bearish candlestick. The shorter the body of the bullish candlestick, the longer the body of the bearish candlestick, and the more powerful the signal is.


Kicking Pattern
This is a reversal signal that occurs in the beginning of a trend, during a trend and at the end of a trend. It is bullish kicking when a bearish Marubozu (open equals to high and the close equals to low of the period) is followed by a bullish Marubozu (open is the low and the close is the high of the period).

Kicking can also produce a reversal signal in an uptrend. It can be bearish when a bullish marubozu is followed by a bearish Marubozu.

Dark Cloud Cover
A bearish candlestick appears after a long bullish candlestick. The bearish period gaps above the high of the bullish and closes below the midpoint of the bullish candle’s body. This may indicate the end of a bullish trend and signals a selling opportunity. This pattern is a reversal signal but it should be ignored if it does not occur after an uptrend.

Bullish Harami Line
As a potential market reversal, the harami line is a sign of consolidation in the market. It implies that the market can reverse upward and traders may need to wait for a confirmation before deciding to buy or sell. Its formation results from a bullish candlestick following a longer bearish candlestick. The bullish candle is completely engulfed by the body of the bearish candlestick. It must be ignored if it does not occur after a downtrend.

Xglobal Group
we introduce you to our group of forex companies:
XGLOBAL AFRICA
XGLOBAL Africa (Pty) Ltd is south African Financial Firm regulated by the FSCA with FSP 51306
XGLOBAL Markets
XGLOBAL Markets Ltd is a European investment firm that is authorized and regulated by the Cyprus Securities
XGLOBAL FX
XGLOBAL FX Ltd is an international broker regulated by VFSC (Vanuatu Financial Services Commission)
Bearish Harami Line
A bearish candlestick follows a larger bullish candlestick. The bearish candlestick is fully nested by the previous bullish candlestick. As a reversal signal it needs to be ignored if it does not occur after an uptrend.

Matching Low
A long bearish candlestick is followed by another bearish candlestick. However, both of them have the same close that suggests a short term support is forming and may cause a reversal on the following candlestick.

Piercing Line
This is a reversal bullish signal. You should ignore this if it does not occur after a downtrend. The bullish candlestick opens below the low of the previous bearish candlestick. However, prices move higher and the candlestick closes above the midpoint of the previous bearish candlestick body.


