What is a Japanese Candlestick?
The Japanese used technical analysis to trade rice futures back in 1600. Munehisa Homma, one of the Japanese traders who used to trade futures in 1700s, discovered that despite the link between supply and demand of the rice, the futures market was also influenced by the traders’ emotion of fear and greed. He realized back then that there could be a vast difference between the value and the price of rice. This principle to measure market emotions are the foundation for the candlestick chart analysis.The Formation and Component Parts
To create a candlestick, you need to have the following values for each time you want to display.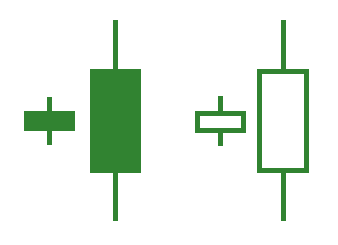
sh Patterns
When the body is longer, the buying or selling pressure is more intense. On the other hand, short bodies represent small price changes which is an indication of price consolidation.
For long coloured candlesticks, the close prices are much higher than the opening prices and they represent that the prices have advanced significantly within that time period. As a result, this reflects that the traders were buying aggressively during that long coloured candlestick. These long coloured candlesticks are considered as bullish but a trader needs to take into account a larger technical picture. When a long coloured candlestick comes in place after extended declines, this can mark a potential turning point of the market. When the long coloured candlestick comes in place after a long advance in the market, then this may lead to excessive bullishness.
The long white candlesticks show that the close prices are much lower than the opening prices. This indicates that prices have declined significantly. Therefore, the traders were selling aggressively within that time period. If a long white candlestick appears after a long advance it may consider as a turning point. After a long decline, a long white candlestick indicates excessive bearishness.
Now let’s concentrate on the shadows. As already said, the upper shadows represent the high prices and the lower shadows represent the low prices. For the candlesticks that have short shadows, this means that the trading occurred close to the open and close price of this specific time period. Contrary, when you have long shadows, it means that the prices within that time period have extended well past the open and close prices.
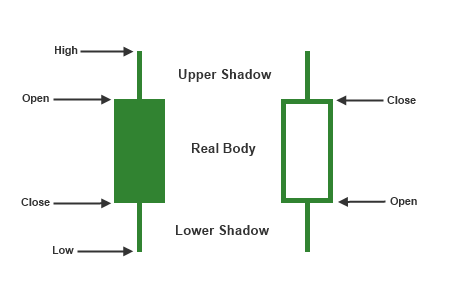
When the real body is small but you have long shadows, it means that there exists a wide range of price changes through the period which is a sign of market indecision. This is due to the small body as this shows a small movement between the open and close price despite that the prices moved significantly during that period.