Why your take profit / stop loss did not trigger on the chart price
If you have ever noticed the take profit or stop loss you set wasn’t triggered when watching the chart price or candle touch the TP / SL line, then you may be interested to know there is a simple explanation why. In fact, a lot of MetaTrader users experience this on sell orders and they often think there is a technical issue with the platform. In this article we are going to explain exactly how the platform works and help you ensure you know when your stop will be hit when monitoring the chart.
The first point to understand is that:
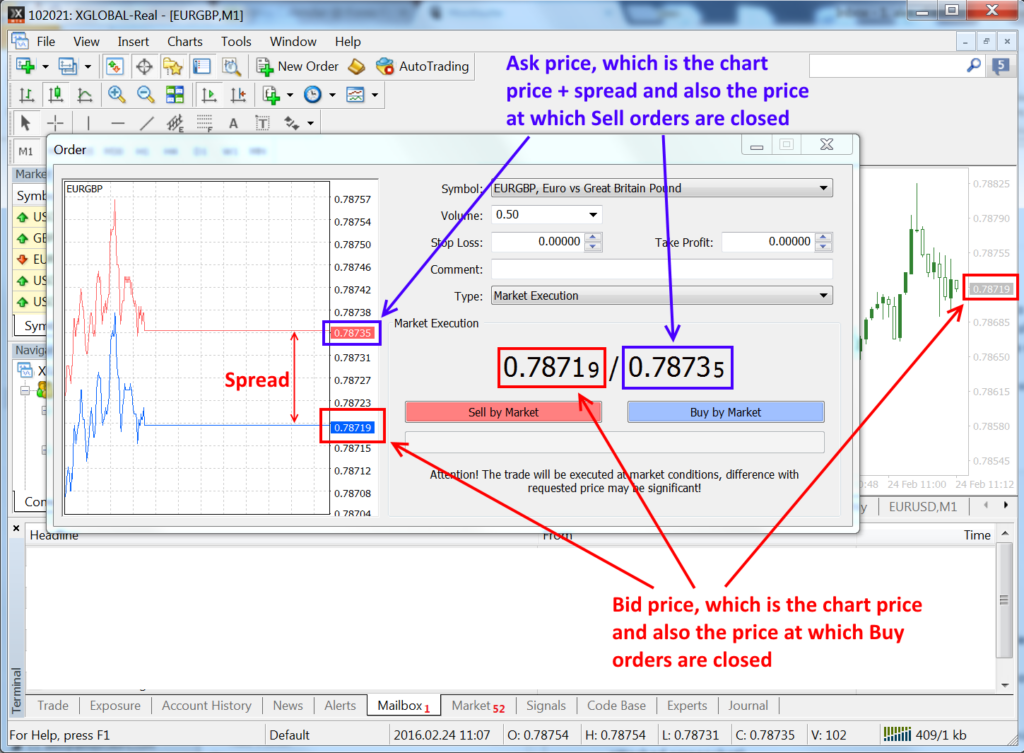
- The price shown on the chart is the bid price (not the ask) and the candlesticks are all made up from the bid price (not the ask).
The second points to understand is the following:
- The difference between the bid price and the ask price is the spread.
- Buy orders open at the ask price (chart price + spread) and close at the bid price (chart price).
- Sell orders open at the bid price (chart price) and close at the ask price (chart price + spread).
The below screenshot provides a visual explanation of the two important points detailed above:

In the event you are unable to login to the website client area you can reset your password for the client area using the “Forgot your password” link on the login page.
If you are having any difficulty with the above process and are still unable to login to your trading account please contact client support and someone will be happy to assist.
Why sell orders don’t close at the chart price
Further to the above, sell orders do not close at the price indicated on the chart as the chart is drawn from the bid price (not the ask). Instead they close at the chart price + the spread. That is the simple reason why, on sell orders, that the take profit or stop loss is not triggered when the chart price/candle exactly touch the take profit or stop loss lines overlaid on the chart.
Adding the ask price to the chart
In order to see exactly when your take profit or stop loss will be triggered from the chart you can add the ask price to the chart, so that the chart contains both the bid and ask pricing. To do so please follow the below procedure:
- Right click on the chart and select “Properties” from the menu.
- A Properties dialog box will appear for that chart.
- Click the Common (in MT4) or Show (in MT5) tab to reveal options.
- On the right hand side check the option “Show Ask line” and click OK.
- Now the chart will display both the bid and ask prices.

